

Diversification
/Asset Correlations
Asset Correlations
Learn what correlation shows, how to compare time periods, and how PortfoliosLab calculates each value.
Correlation shows whether two assets historically tended to move together, move independently, or move in opposite directions. It can reveal when holdings that look different have behaved similarly in the market.
The value ranges from −1 to 1:
- A value near 1 means the assets usually moved in the same direction.
- A value near 0 means there was little consistent relationship between their movements.
- A negative value means the assets tended to move in opposite directions. Values near zero show only a weak relationship.
Correlation describes past behavior. It does not predict returns or establish that an asset belongs in a portfolio.
Open the Asset Correlations tool to compare holdings, a portfolio, and an optional benchmark.
Correlation Heatmap
The Asset Correlations result is a color-coded table. Each cell compares the asset in its row with the asset in its column.
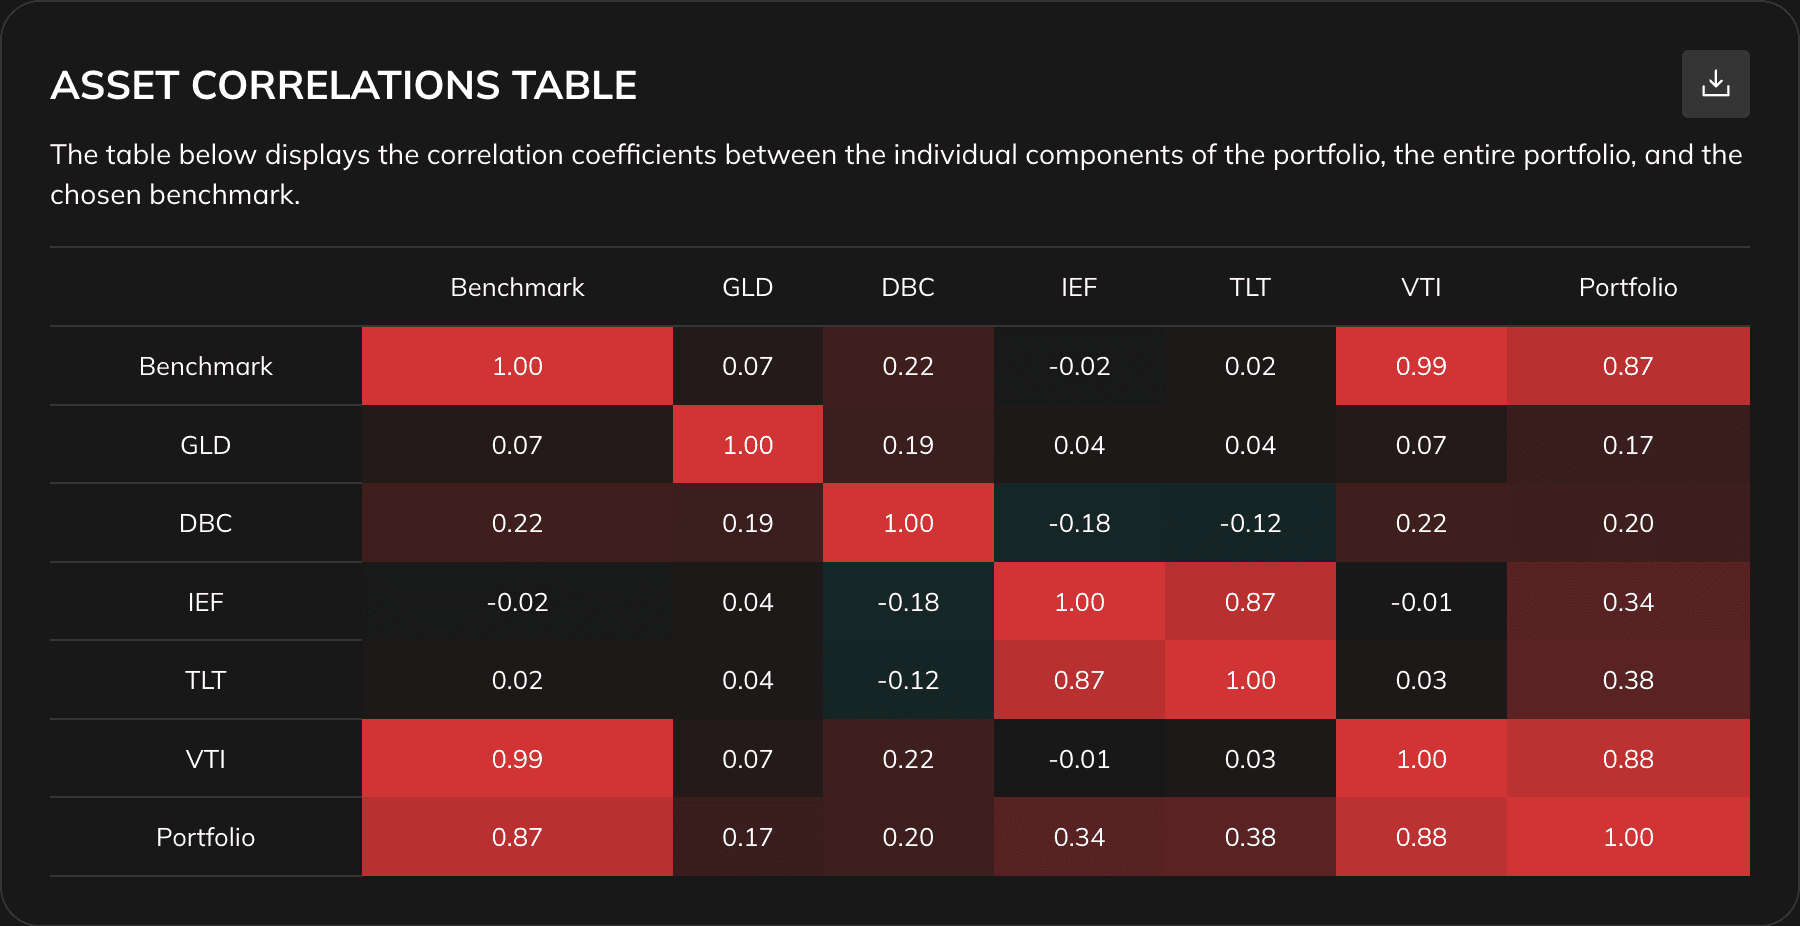
Green cells show negative correlation, white cells are near zero, and red cells show positive correlation. The diagonal is always 1.00 because each asset is being compared with itself.
The closer a value is to either end of the scale, the more consistent the historical relationship was. A correlation of 0.80 is a stronger same-direction relationship than 0.20. A correlation of −0.60 is a stronger opposite-direction relationship than −0.10.
Do not treat the colors as grades. A green cell does not automatically make an asset a good investment, and a red cell does not automatically make it unsuitable. Correlation is one part of the portfolio picture.
Negative Correlation
Negative correlation means two assets often moved in opposite directions during the period being measured. When one had a relatively stronger day, the other tended to have a relatively weaker day.
It does not mean one asset rose every time the other fell. For example, a correlation of −0.10 indicates only a weak opposite-direction relationship. Even a stronger negative relationship can weaken or reverse when market conditions change.
Negative correlation can reduce combined volatility when both assets have meaningful portfolio weights. It should still be considered alongside volatility, drawdowns, exposure, costs, and liquidity.
Negative correlation observed in the past does not guarantee protection in the next market decline.
Why Diversifiers Show 1Y, 3Y, and 5Y
Correlation changes over time, so the symbol-level Diversifiers pages show three periods instead of relying on one number.
1Y: Recent behavior
The one-year value responds fastest when the relationship changes, but it can also move around the most.
3Y: A balanced view
The three-year value combines recent behavior with more history, reducing the influence of a short episode.
5Y: Longer-term evidence
The five-year value shows whether the relationship persisted over a longer period, although older observations may be less representative of current conditions.
A candidate that remains low across all three periods has shown a more persistent relationship than one that is low only over 1Y. A large gap between the 1Y and 5Y values is also useful: it shows that the relationship has been changing.
The longer labels use the history available inside each window. A 5Y column does not guarantee that every pair has five complete years of overlapping observations.
Symbol Diversifier Ranking and Filters
A symbol Diversifiers page compares one stock or fund with other eligible assets. The table sorts candidates from the lowest correlation to the highest for the selected 1Y, 3Y, or 5Y column. The default sort uses 1Y correlation.
The count above the table shows how many eligible candidates have correlation below 0.30 and how many have correlation below 0. The table itself is not limited to those thresholds.
Before ranking candidates, PortfoliosLab applies these filters:
- The selected candidate type: ETF, mutual fund, or stock.
- The same market as the source symbol when market information is available.
- A PortfoliosLab Risk / Return Rank of at least 50.
- An available correlation value for the selected period.
- No delisting date or alternate-listing marker.
- For stocks, a market capitalization of at least $1 billion.
These filters remove obvious listing and quality issues. They do not establish that a candidate is suitable for a particular portfolio. The Diversification Analysis guide explains the stricter filters used for portfolio-level candidates.
How PortfoliosLab Calculates Correlation
PortfoliosLab compares percentage returns rather than raw price levels. In plain terms, the calculation checks whether two assets tended to have their stronger and weaker days at the same time.
The calculation uses Spearman rank correlation:
- PortfoliosLab retrieves adjusted closing prices, which reflect splits and distributions recorded in the price history.
- Prices are converted to a common reporting currency when necessary.
- Prices are converted into percentage returns, and matching dates are aligned.
- Each return series is ranked from lower to higher, and the correlation between those ranks is calculated.
Spearman correlation focuses on whether the direction and ordering of the returns moved together. It is less affected by the exact size of an unusually large daily move than Pearson correlation, but it still has the limitations of any historical estimate.
The period depends on where the value appears:
| Product surface | Period used |
|---|---|
| Asset Correlations | The selected lookback, from three months to the maximum available history |
| Symbol Diversifiers | Trailing 1Y, 3Y, and 5Y windows |
| Portfolio and comparison correlation tables | The selected analysis period |
Asset Correlations uses about 21 trading observations per month and 252 per year when converting a selected lookback into observations. Symbol Diversifiers use calendar cutoffs from the latest available observation.
Limits of Correlation
Correlation does not show:
- Whether the relationship will continue in a different market environment.
- Whether the assets become more closely related specifically during market declines.
- How large either asset's gains, losses, or volatility were.
- Whether two funds own the same securities or share the same economic exposure.
- Expected return, valuation, liquidity, costs, or tax consequences.
Use Asset Correlations to compare periods. Use Diversification Analysis to review portfolio weights, clusters, diversification metrics, and portfolio-level candidates.