New: Inflation-Adjusted Performance & Drawdowns
We’ve added support for inflation-adjusted performance and drawdown calculations, giving you a clearer picture of how your portfolio performs in real economic terms.
Nominal returns alone don't reflect how much value your portfolio is truly gaining (or losing) over time. Inflation erodes purchasing power, so what looks like positive performance on paper may not translate to real-world growth.
With this update, you can now adjust performance metrics to account for inflation and view drawdowns in real terms, showing actual value loss and recovery.
A drawdown typically tracks how far a portfolio falls from a peak and how long it takes to recover. However, in most cases, a true recovery isn’t just returning to the previous nominal high, it means the portfolio’s value must grow enough to outpace inflation over the entire drawdown period.
By adjusting for inflation, you get a more accurate view of:
- How deep the loss really was
- How long it truly took to recover
- Whether your capital actually regained its real-world value
This makes the drawdown metric significantly more informative, especially for long-term investors. You can explore these updates directly in the following tools: Portfolio Performance Calculator, and Drawdown Analysis Tool.
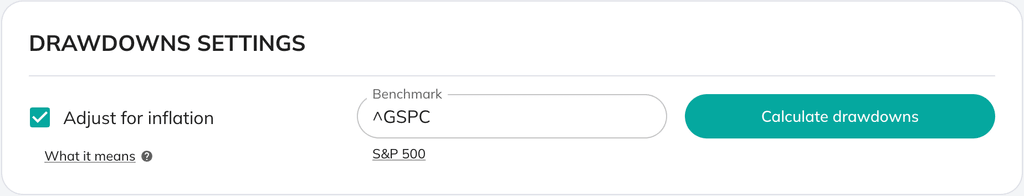
Just check the “Adjust for inflation” option on the settings panel:
We use CPI data from FRED to adjust for inflation, helping you better understand your portfolio’s real-world performance.
0 комментариев
Сортировать по