New Portfolio Metrics: Alpha, Beta, R², Upside and Downside Capture
When you're looking at a portfolio, knowing it returned 12% last year isn't enough. You want to know how it behaves relative to the market. Was your strategy just riding the market or did it have a real edge? The block shows five metrics at a glance: Alpha, Beta, R², Upside Capture, and Downside Capture.
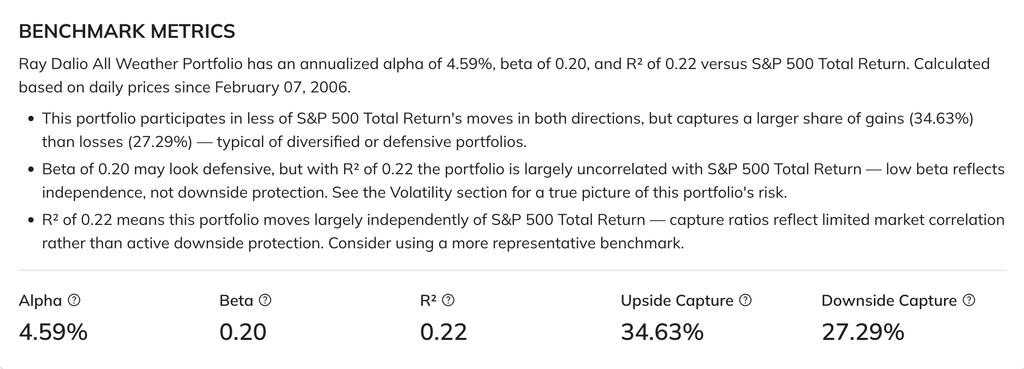
To make it more useful, we also added a few insights alongside numbers. Raw numbers alone can mislead. A beta of 0.5 looks defensive, but only means something if R² is high enough. A portfolio capturing 200% of upside and 106% of downside is technically "favorable" but that's not the whole story. The block catches these cases and calls them out directly.
When R² is too low for the metrics to be meaningful, it tells you to pick a better benchmark rather than letting you draw the wrong conclusions.
Available on all portfolio pages where a benchmark is selected and in the Portfolio Analysis tool.
1 комментарий
Сортировать по
Hi,
great job. Having these numbers available in the stock and ETF screeners would be amazing, too. :)
Cheers.