Walk-Forward Backtesting for Portfolio Optimization
How strategy backtests usually work. You input your portfolio positions and ask the optimizer to find an allocation with best performance. The optimizer then looks at the historical data, picks a few stocks that did well, drops the rest and presents you with a portfolio that would have crushed it over the last years. When comparing with the original allocation the backtest looks great. Of course it does. The optimizer already knew what happened.
This is called lookahead bias, and it makes backtests almost useless for predicting real-world performance. So we've added a way to test your portfolio strategy without it.
What we built
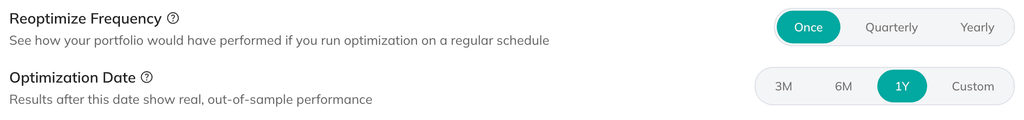
In Portfolio Optimization, there's now a Reoptimize Frequency setting with three modes: Once, Quarterly, and Yearly.
Set it to Quarterly or Yearly, and the tool will re-run the optimization at the start of each period — using only the data available at that point in time — then measure how the resulting portfolio actually performed over the next period. This repeats across the entire timeline, giving you a realistic picture of how the strategy would have played out if you'd been running it live.
This is different from the Optimization Date setting, which works in the default "Once" mode. That one splits your data at a specific point: the optimizer trains on everything before that date, then you see how the resulting weights performed afterward. Useful, but it's still a single optimization — one set of weights tested against one future period.
Walk-forward takes it further by re-optimizing repeatedly, so every period gets weights that were calculated without any knowledge of what came next.
Why it matters
A single-point optimization tells you what worked in the past. Walk-forward optimization tells you whether your strategy is robust enough to keep working as the market changes.
If the out-of-sample results hold up across multiple rebalancing periods — through rate hikes, drawdowns, recoveries — you have something. If they fall apart, better to know that here than after you've deployed capital.
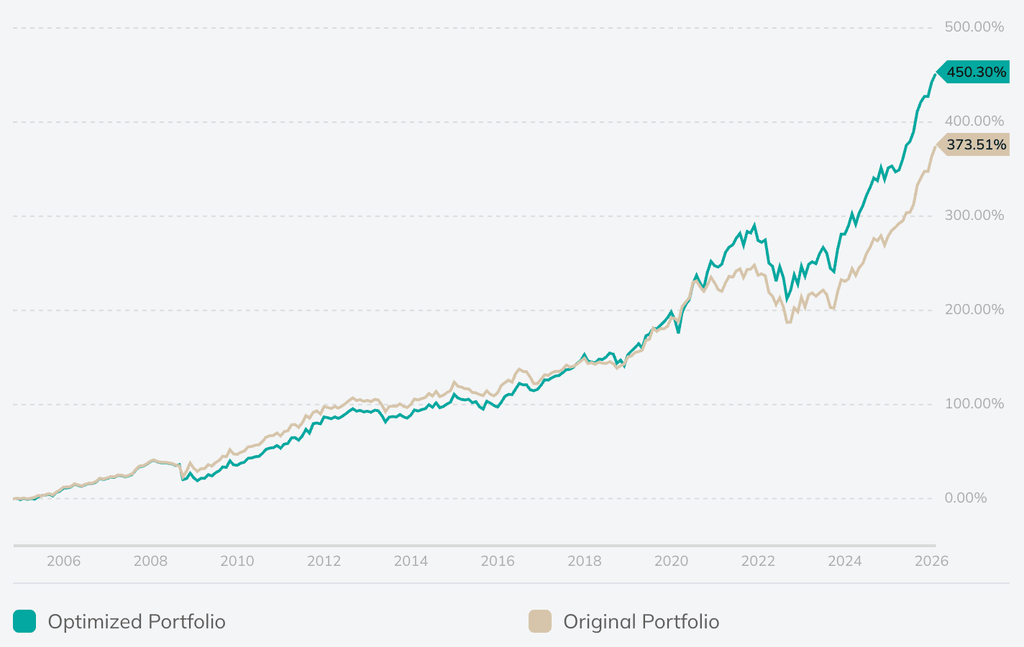
Harry Browne's Permanent Portfolio with a periodic optimization vs the original static allocation.
A few ways to use it
Set Reoptimize Frequency to Yearly and compare the walk-forward result against your original allocation. If the optimized weights consistently outperform through different market regimes, that's a meaningful signal about the strategy's durability.
Try different training windows alongside it. A 1-year window will react faster to recent market shifts; a 3-year window produces more stable weights. Walk-forward backtesting helps you see which one actually generalizes instead of just fitting the past.
Availability
Walk-forward backtesting is available on Plus and Pro plans. Single-point optimization (the default "Once" setting) works the same as before for all users.
1 комментарий
Сортировать по
Great stuff Dmitry, as you know I working a lot with PRT for the actual investing. Therefore as you wanted to you could refine the walk-forward approach by implementing anchored and non-anchored and calculating WFE. (the following is quoted from the public guide, https://www.prorealtime.com/en/pdf/probacktest.pdf)
Walk Forward analysis is an essential part of developing a trading strategy. It allows you to optimize a trading system and to validate its robustness and stability over time. First, the walk forward analysis optimizes a set of variables on an initial period called "in-sample data" or the "optimization period", then it tests the best parameters on the following period called "out of sample data" or the "test period", and repeats the process by shifting forward the time windows. This automated process can be repeated as many times as necessary. The optimization periods (in-sample) may have a single starting point (Anchored mode), or different starting points (Non-anchored mode). NON-ANCHORED MODE ANCHORED MODE By comparing the results of these 2 periods, the method allows you to: Check that the performance of the strategy on the optimization periods (in-sample data: shown in blue) are consistent with the test periods (out-of-sample data: shown in grey). This avoids the risk of "overfitting" by projecting the strategy on a period of time not used itself in the optimization. Check how the strategy behaves in changing market conditions Test the strength of the strategy on past data To determine if a strategy is robust or not, we use the WFE ratio (walk forward efficiency ratio). The walk forward efficiency ratio is a qualitative indicator of the optimization process. It compares the annualized gain of the test period to the annualized gain of the optimization period. This measure of robustness is a critical part of walk forward analysis. WFE Ratio = Annualized gain of the test period Annualized gain of the optimization period Annualized gains are the gains realized over a given period, expressed in annual terms. They let us compare the gains of different periods on a common basis. Typically, the optimization period (in-sample/blue in the image above) represents 70% of the total analyzed period, and the test period (out of sample/grey) 30%. To measure the reliability of the analysis, the results of the two periods need to be evaluated with a common basis. Studies of this method indicate that if at least 3/5 test periods display a WFE ratio greater than 50%- 60%, the strategy can be considered to be robust. After the walk forward method, it is interesting to analyze the results of several points. It is necessary to examine the regularity of gains from post-optimization periods. If the results show that the strategy shows a risk of being over-optimized (= the gains from test periods are much lower than those of optimization periods), the platform lets you adjust different parameters (variables, stop and target levels, trading periods) and launch a walk forward analysis again, as many times as needed, to obtain a robust strategy