Dividend Charts and Dividend Aristocrats
DS
Dmitry Shevchenko01 ноября 24 г. | Опубликовано в Анонсы
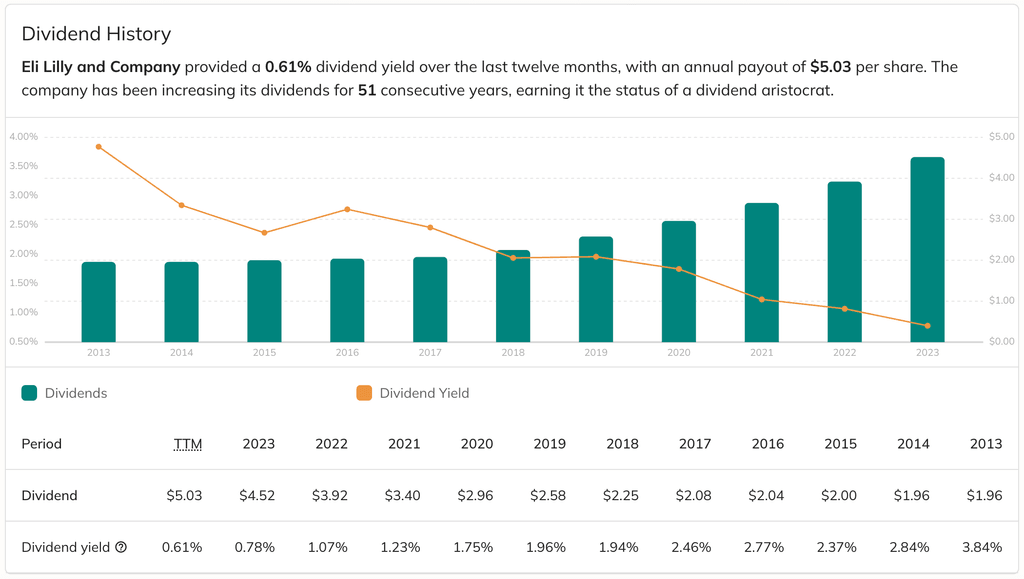
We're excited to announce the addition of dividend charts to your investment toolkit. Now, you can easily visualize both dividend payouts and yield history in a clear, easy-to-read format, allowing you to identify a company's dividend trends at a glance.
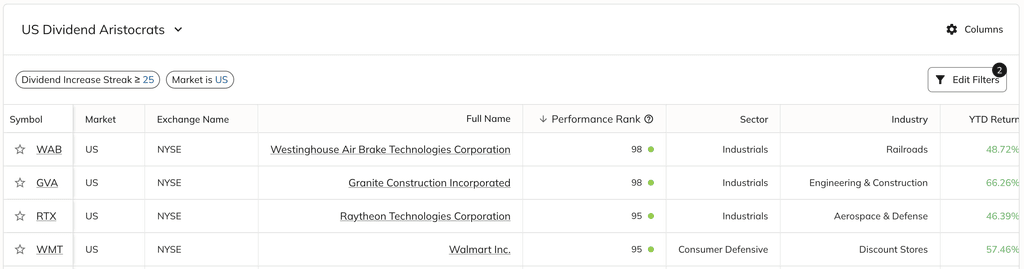
To enhance your experience further, we've introduced the Dividend Increase Streak indicator. This feature tracks the number of consecutive years a company has increased its dividends, making it easier to identify dividend aristocrats and build reliable, income-focused portfolios. You can access this indicator in the stock screener, accessible to all subscription tiers!
Check it out today to find companies that align with your dividend investment strategy!
0 комментариев
Сортировать по
Самые старые