Invest smarter, not harder: get data-driven insights
Transform complex data into actionable insights with our professional yet simple tools.

Unique indicators used by leading quantum funds
Risk, profitability, and dividend analysis
Beginner-friendly interface, expert-ready functionality
Hassle-free solutions for mundane tasks
Unique indicators used by leading quantum funds
Risk, profitability, and dividend analysis
Beginner-friendly interface, expert-ready functionality
Hassle-free solutions for mundane tasks
Simplify Wealth Building for You and Your Clients
For Enthusiasts
Unique indicators used by leading quantum funds
Get a detailed professional analysis instead of raw data
Use the service smoothly: no special knowledge needed
Make decisions based not only on the potential returns but also on the risks involved
Gain valuable insights with our curated Lazy Portfolios or diverse Community Portfolios

For Fund Managers
Manage all the data in one place
Import your own data to PortfoliosLab
Export any data for use in external systems
Utilize hundreds of screener settings
Work with large portfolios (up to 500 positions) and manage your own data
Access indicators based on the latest research

For Financial Advisors
Scale up your business and get more clients
Make convincing presentations to attract new clients using detailed analysis
Create and showcase strategies for various investment goals
Maintain and optimize your clients portfolios with professional tools
Generate reports in a few clicks
Get sharper insights with more than 20 tools
Analyze market trends, stocks, funds, and any other data for the past 40+ years.
Optimization
Grow your portfolio's earnings and keep the risks low. Find the right mix of investments based on your goals.
Performance Analysis
Visualize the gains or losses of a certain portfolio and evaluate its real profitability relative to risk.

Risk Analysis
Estimate stock volatility with nine different instruments, including Drawdowns, Expected Shortfall, and the Ulcer Index. Reduce the likelihood of sudden losses and ultimately improve the risk-adjusted returns of your portfolio.

Compare stocks and decide in seconds
Compare key performance indicators of stocks and pinpoint essential details on the chart.


Build your personal investment hub

Upload & save portfolios

Save the portfolios you use frequently to speed up your work
Customize screener filters

Customize and save the screener settings that work best for you
Maintain up to 10 watchlists

Follow companies you don't have in your portfolio to monitor their dynamics
Try out new platform updates
Many of our best updates came directly from user suggestions. Is there a feature you're looking for that we haven't added yet? Share your ideas, and let us know how we can make your experience even better!
June 05, 26
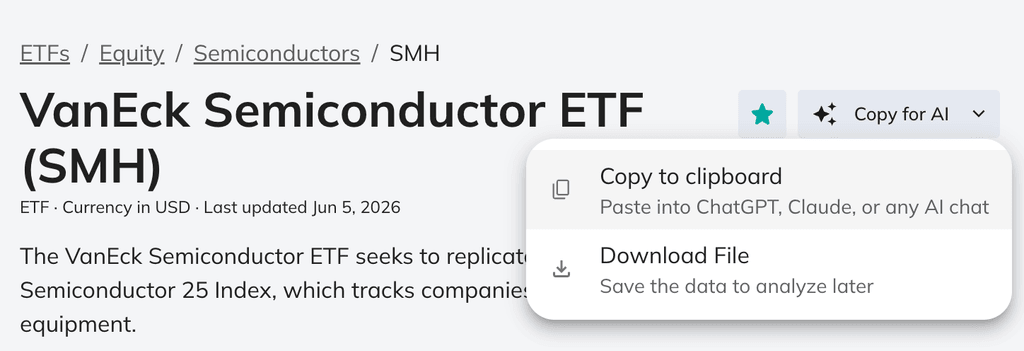
New: Copy PortfoliosLab Pages for ChatGPT or Claude
PortfoliosLab pages can be dense. A symbol or portfolio analysis may include returns, drawdowns, risk-adjusted ratios, benchmark metrics, dividends, correlations, and much more. That is useful data, but it is not always easy to interpret or turn into a clear next question.
We added Copy for AI to make that workflow simpler.
What we added
Symbol pages, portfolio pages, and stock comparison pages now include a Copy for AI button. It turns the current page into clean markdown context that you can paste into ChatGPT, Claude, or another AI chat.
The copied output is structured for analysis rather than screenshots. It includes labeled sections, exact metric names, date ranges, benchmark settings, and tables where the data needs to be compared side by side.
That matters because AI tools are much more useful when they are grounded in the actual numbers. Without providing exact context to AI, you can never tell if it's guessing or not. If the model does not know the benchmark, time period, risk-free rate, drawdown history, or correlation data, it may fill in the gaps. So instead of asking a model to infer from a screenshot or a few manually typed metrics, you can give it the full analytical context and ask a sharper question.
It also makes PortfoliosLab analysis more interactive. You can start with the platform's calculations, then use AI to explore the interpretation: what changed, what looks fragile, what is redundant, and what scenario would hurt the portfolio most.
What you can ask
Copy for AI is useful when you want a second pass on the data. You can ask it to explain a metric, challenge a thesis, compare trade-offs, or stress-test a portfolio against a specific scenario.
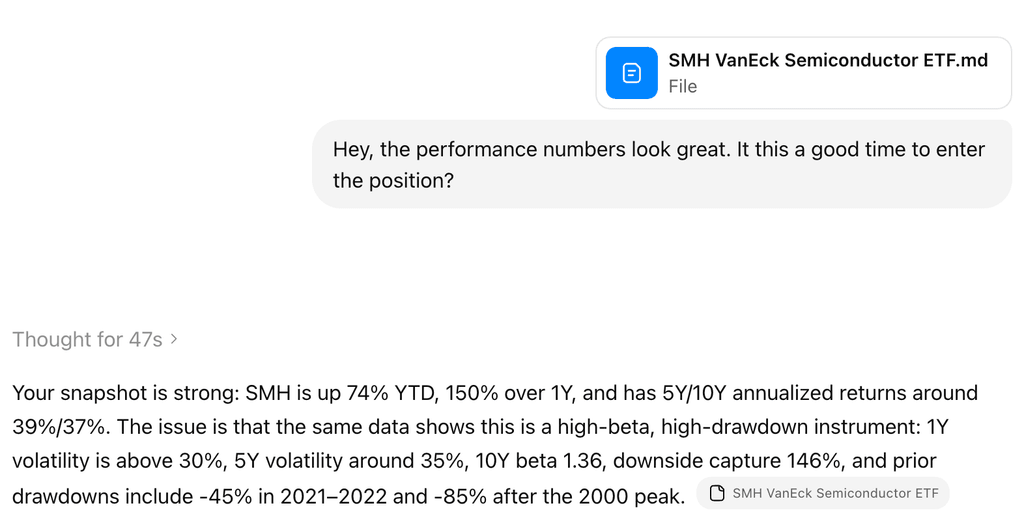
For example, after copying a semiconductor ETF page, you might ask why a one-year Sharpe ratio looks exceptional while the all-time Sharpe ratio is much lower. After copying a portfolio, you might ask whether ten holdings are genuinely diversified or mostly one sector bet. After copying a stock comparison, you might ask whether the extra return is worth the extra drawdown and volatility.
You can also check documentation page with prompt examples and sample copied output.
Availability
Copy for AI is available on Plus and Pro plans.
May 21, 26
New: Portfolio Diversification Analysis
Portfolio diversification is easy to talk about and hard to measure.
Most portfolios look diversified on the surface. A few ETFs, maybe some stocks, maybe a bond fund. But once you look at how the positions actually move together, the picture often changes. Five holdings can behave like two bets. A "defensive" position can stop hedging when rates move. Two ETFs with different names can be almost the same exposure.
We built Diversification Analysis to make that visible.
What we added
The new tool analyzes your whole portfolio, not just one symbol at a time. It looks at correlations between positions, effective asset count, diversification ratio, portfolio clusters, and low-correlation candidates you can add.
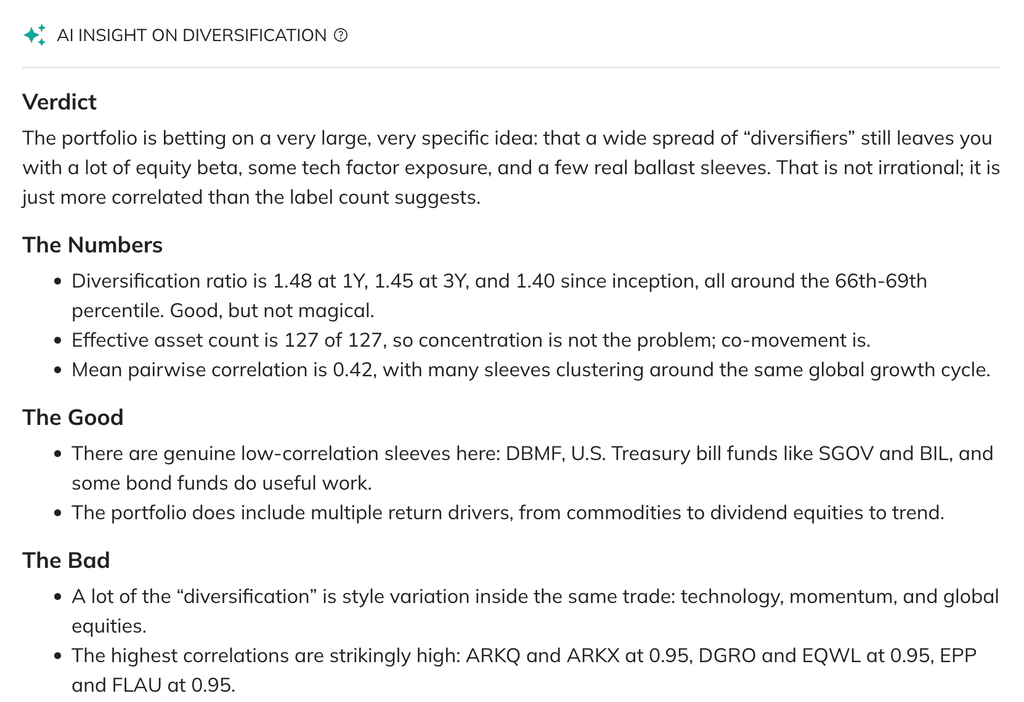
The first thing you see is a plain-English summary of the portfolio. It names the specific positions that are helping or hurting diversification, and explains the trade-off in normal language. Metrics are useful, but sometimes you need the tool to say: these three holdings are mostly doing the same job.
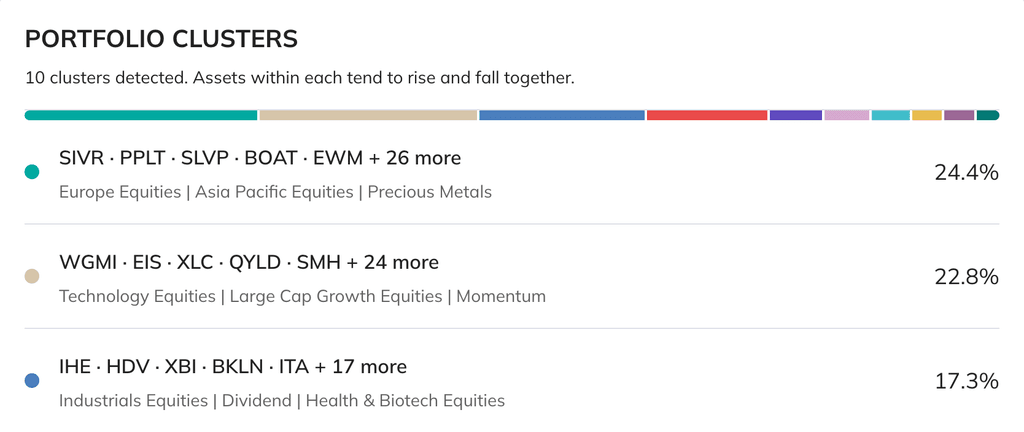
Below that, the tool groups positions into correlation clusters. This is where redundant holdings become obvious. If a portfolio has several large-cap growth ETFs, they may sit in the same cluster even if their issuer, name, and category labels are different.
We also added diversification metrics across multiple periods. Effective asset count shows how many independent bets your portfolio really has. Diversification ratio shows how much volatility reduction you get from combining the assets. Seeing those numbers over 1Y, 3Y, 5Y, 10Y, and all-time helps catch drift. A portfolio can become less diversified without any transaction, simply because correlations changed.
New candidates, not generic lists
The tool now surfaces ETF and stock candidates that historically moved differently from your current holdings.
This is not a generic "top ETFs" list. Candidates are filtered by correlation to the actual portfolio, then by quality. For ETFs we avoid inverse and leveraged products and require meaningful assets under management. For stocks we focus on larger companies and include risk / return rank, so the list is not just "lowest correlation at any cost."
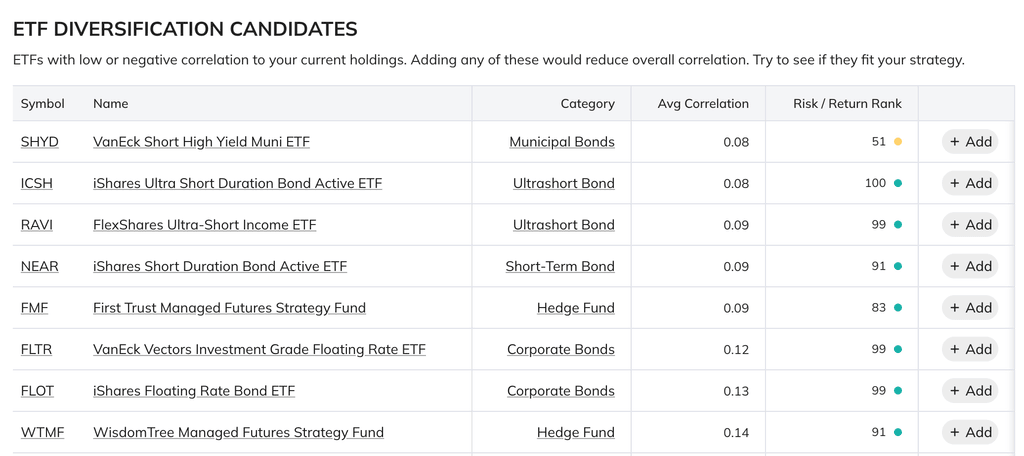
You can add a candidate directly into the portfolio input, rerun the analysis, and see what changed. That makes the workflow much more practical. Instead of guessing whether a commodity ETF, short-duration bond ETF, or defensive stock helps, you can test it against the current portfolio structure.
Why this matters for optimization
Portfolio Optimization works better when the input universe is sane.
If you feed an optimizer five highly correlated ETFs, it can still produce nice-looking weights. But the result may be mostly a reshuffle of the same exposure. The optimizer is not magic. It can only choose from the assets you give it.
Diversification Analysis helps before optimization. Use it to remove duplicates, spot clusters, and find candidates with genuinely different return drivers. Then run optimization on a cleaner universe.
This creates a better workflow:
- Start with Diversification Analysis.
- Remove obvious overlap.
- Add a few low-correlation candidates.
- Run Portfolio Optimization.
- Validate the optimized result with walk-forward backtesting.
That sequence is more useful than optimizing first and trying to explain the result afterward.
A few ways to use it
You have a 3-5 ETF portfolio and want to know what is missing. Run Diversification Analysis, look at the clusters, then check ETF candidates. If all holdings behave like equity beta, the tool will usually make that obvious.
You are preparing a portfolio for optimization. Before running HRP, Risk Parity, or Mean-Variance Optimization, use the clusters to remove duplicates and add assets with different behavior. The optimization result should be more stable because the input set is better.
You are reviewing an existing allocation after market conditions changed. Correlations are not fixed. The 1Y view may show that a hedge is no longer doing what you expected, while the longer windows show whether this is temporary or structural.
Try Diversification Analysis with your portfolio
April 26, 26
New: Diversifier Pages for ETFs and Mutual Funds
You know you should diversify. But finding what actually moves differently from what you already own has always been surprisingly hard. We added Diversifiers to help with that.
What we added
Every ETF and mutual fund on PortfoliosLab now has a Diversifiers page. Open a fund (for example, SMH) and you can see ETFs, mutual funds, and individual stocks that historically moved differently from it.
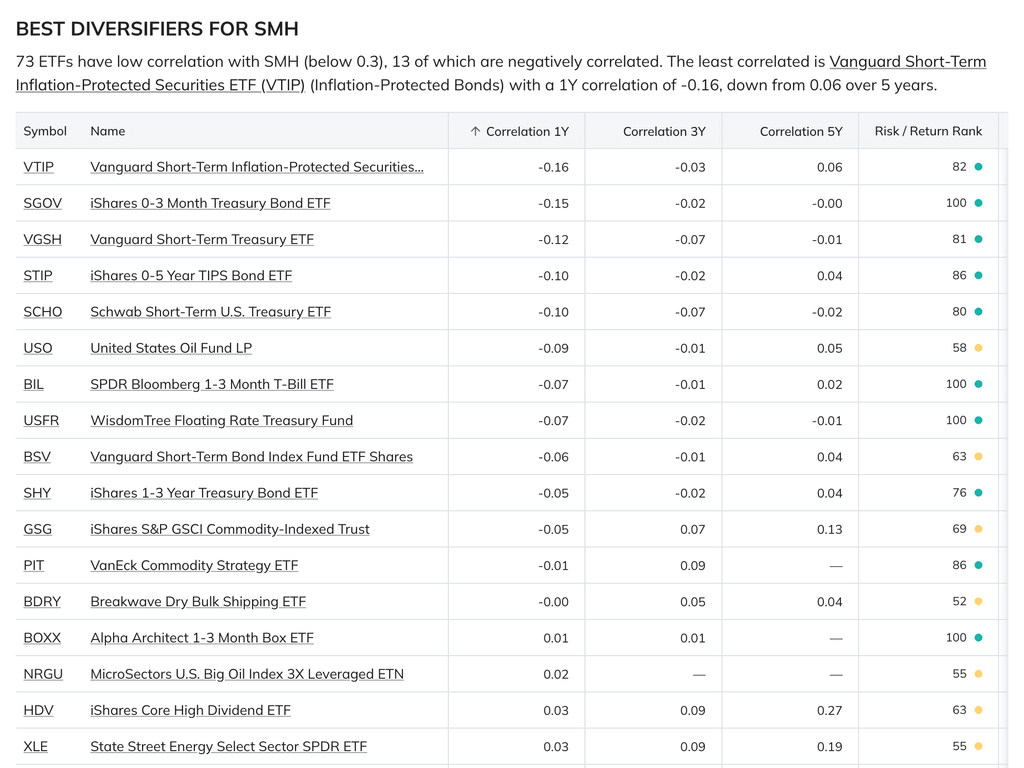
The page focuses on correlation across 1-year, 3-year, and 5-year windows. That matters because correlation is not fixed. Two assets can look independent over one period and start moving together later. Seeing several time windows helps you spot whether a diversifier is stable, improving, or becoming less useful.
Each page includes a data summary highlighting how many low-correlation funds exist for a given symbol, which asset categories dominate the list, and whether correlations are strengthening or weakening over time. For example, SMH currently has 73 ETFs with low correlation, 13 of which are negatively correlated — and the results go well beyond the obvious bond funds. Scroll past the treasuries and you will find oil, commodities, shipping, energy equities, and dividend funds that all move independently from semiconductors.
Low correlation alone is not enough. A fund can appear uncorrelated simply because it is poorly managed or drifting from its benchmark. Every result on the Diversifiers page includes PortfoliosLab's Risk / Return Rank, which scores funds on risk-adjusted performance. That way you are looking at assets that move differently and are still worth owning on their own.
For stocks, we show U.S. companies with at least $1B market cap that move independently from the fund you are researching, together with sector context and the same Risk / Return score.
Behind the scenes, we recalculate millions of correlation pairs daily across 3,000+ ETFs, mutual funds, and large-cap stocks. Every page reflects the latest available data, not a static snapshot.
Why this matters
Having many positions is not the same as being diversified.
You can hold five large-cap growth ETFs and still have one big bet. You can add another fund that looks different by name, but behaves almost exactly like what you already own. Your broker will show another line in the account. It will not tell you whether the new position actually reduces portfolio risk.
Diversifiers starts from the asset you already know and answers the next question: what can I pair with this that brings a different return driver?
That is useful when you are building a long-term portfolio and want fewer assumptions. Not "I think this should diversify me", but "this has historically moved differently, and I can see how stable that relationship has been."
A few ways to use it
Complement a core holding. You hold a broad U.S. equity ETF and want to add something that is not just another version of the S&P 500. Open its Diversifiers page and look for funds with consistently low correlation across multiple periods.
Find independent stock ideas. You want stocks that behave differently from a fund you own. Use the low-correlation stocks table as a starting point, then compare anything interesting before adding it to your portfolio.
Already checked a fund's Alternatives? Diversifiers answer the opposite question — not what to swap, but what to pair.
Availability
Diversifier pages are live for every ETF and mutual fund on PortfoliosLab. Free users can preview the top results. Pro users get full ranked lists with correlation trends across 1Y, 3Y, and 5Y.
Try it now: SMH Diversifiers →
Recently added tickers
START TODAY TO GET PROFIT TOMORROW
Earn above-market returns easily
Simplify and speed up your work process
Use actual data based on relevant research
Be confident in your investment decisions