Better portfolio decisions for long-term investors
PORTFOLIO INTELLIGENCE
From researching assets to optimizing your allocation — see what your broker can’t show, and act on it
Analyze your portfolioFrom your first idea to a portfolio strategy — All in one place
//01
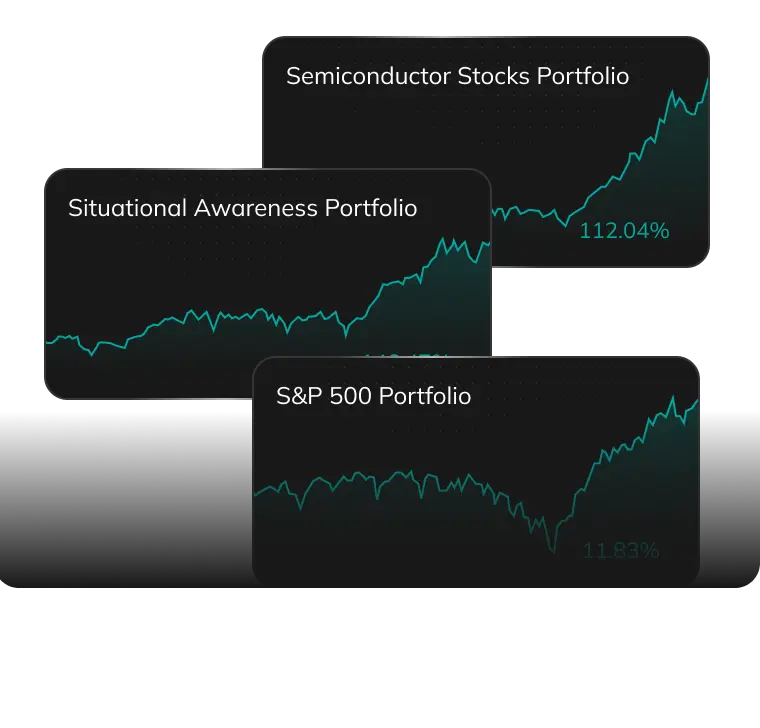
Explore ideas
Discover new opportunities across assets, sectors, and strategies
//02
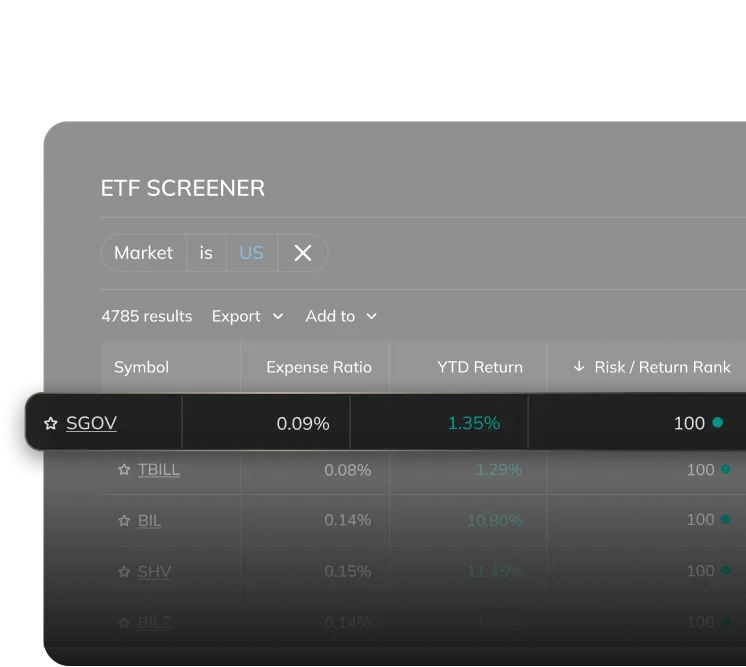
Spot the strongest options
See which opportunities stand out on risk, return, and portfolio fit
//03
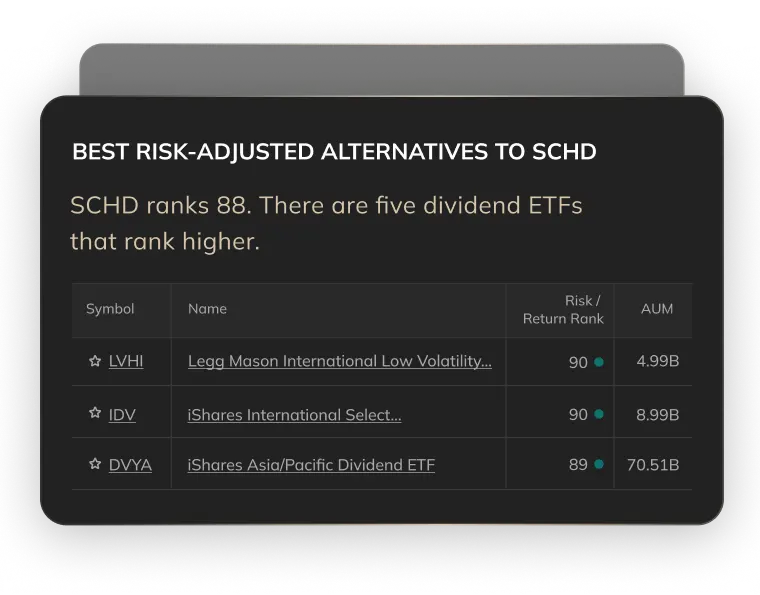
Choose what fits
Focus on assets that match your goals. Buy what you need, not what everybody's buying
//04
Validate Strategy
See how your portfolio would have held up — before you commit
//05
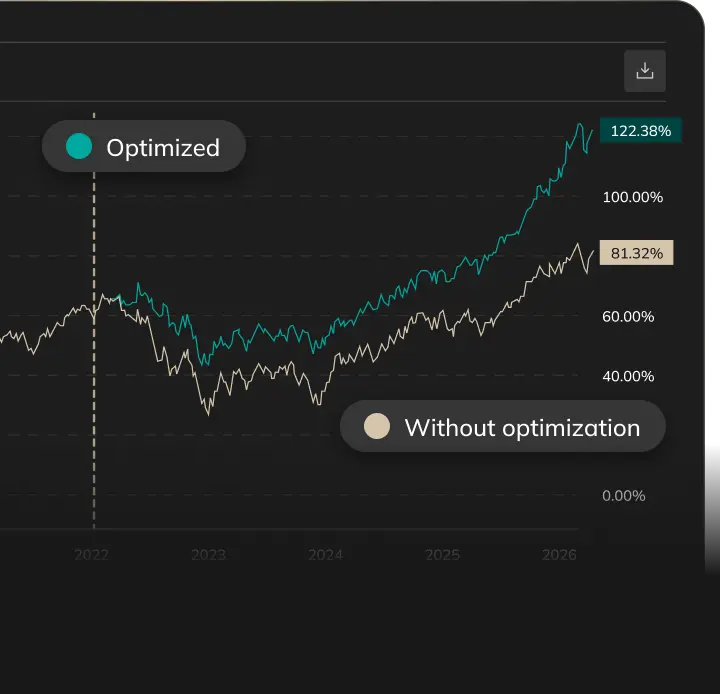
Get your best allocation
Get an optimized allocation for your goals, backed by math

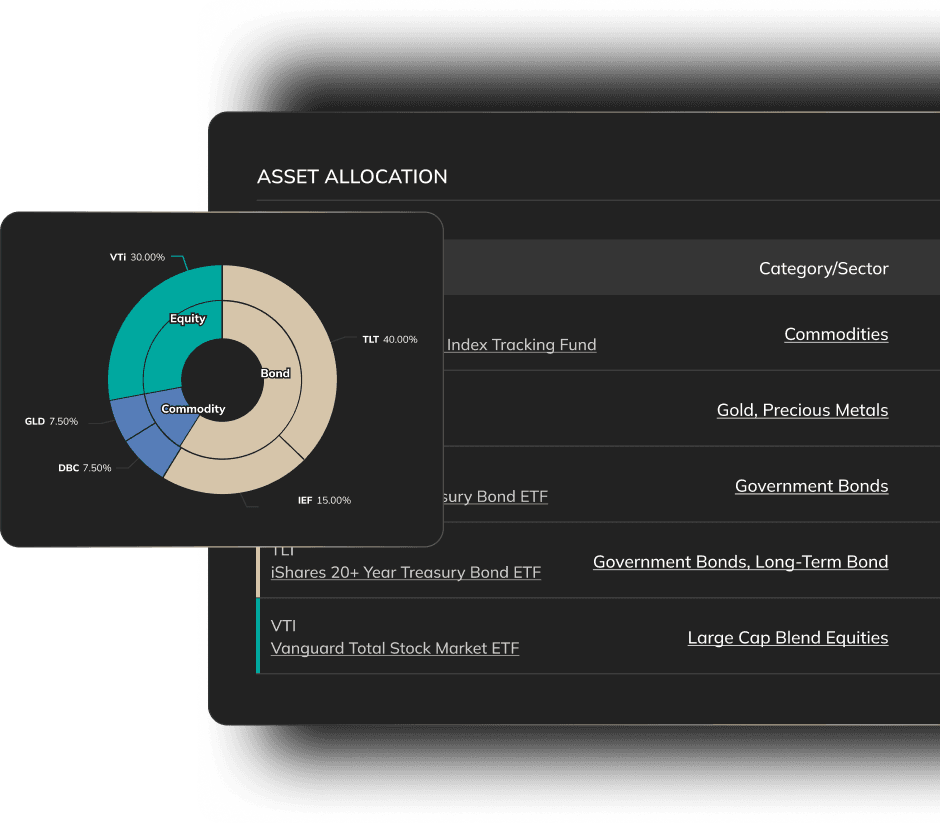
See the full picture — not a list of holdings
Discover hidden overlaps and correlations that broker doesn't show you
Your "diversified" portfolio might move as one
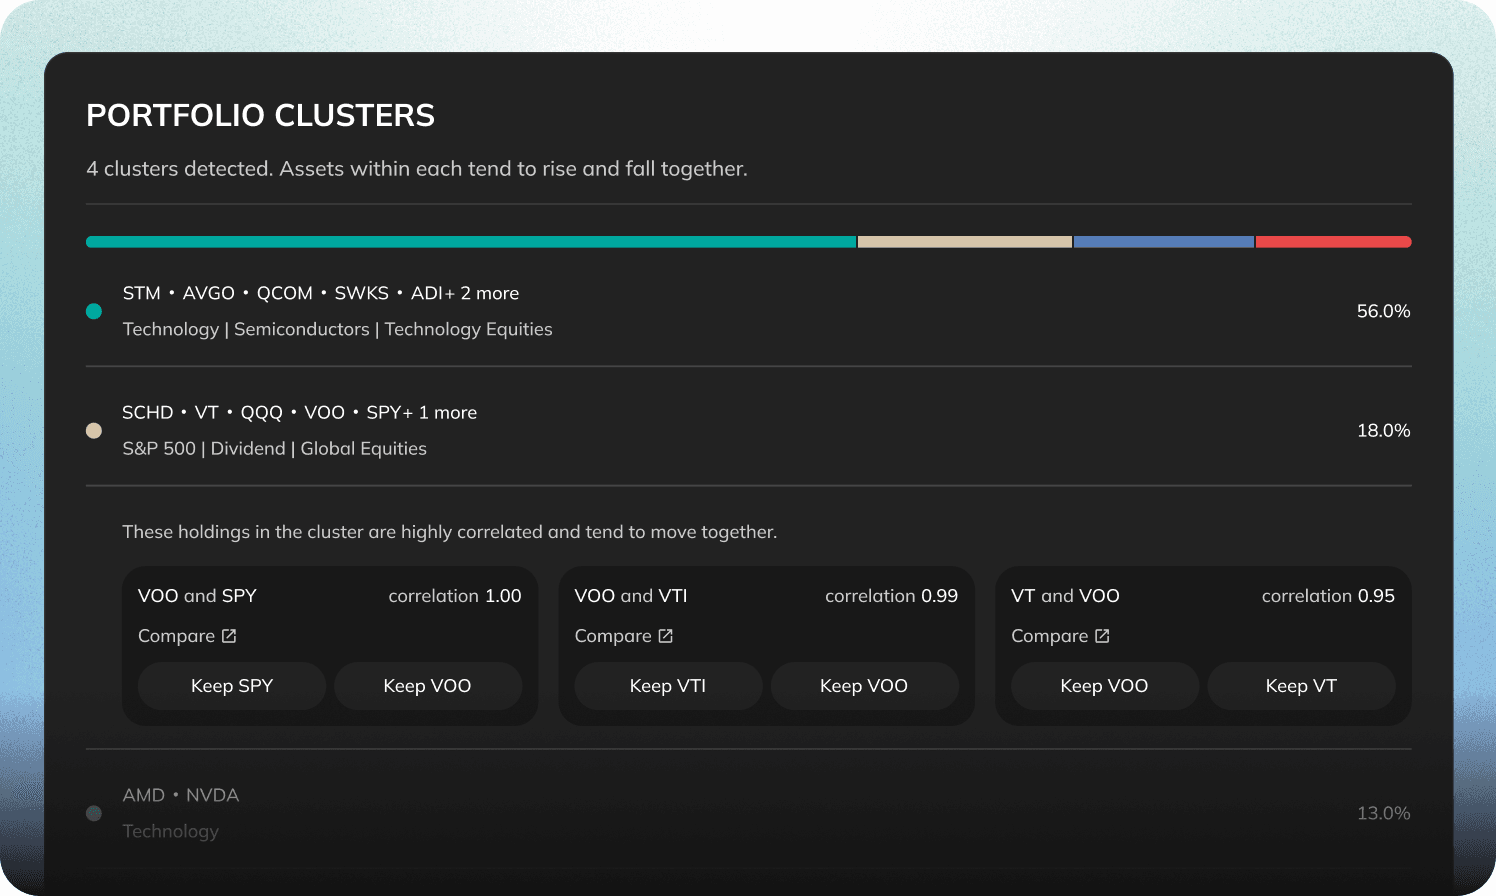
What you're not seeing
Four positions here look like four bets. They're really one — clustered together, they'll drop together the moment markets turn.
What it costs you
50%+ of this portfolio sits in a single cluster. In a downturn, the diversification you're counting on won't be there when it matters.
Concentration stays invisible — until it costs you
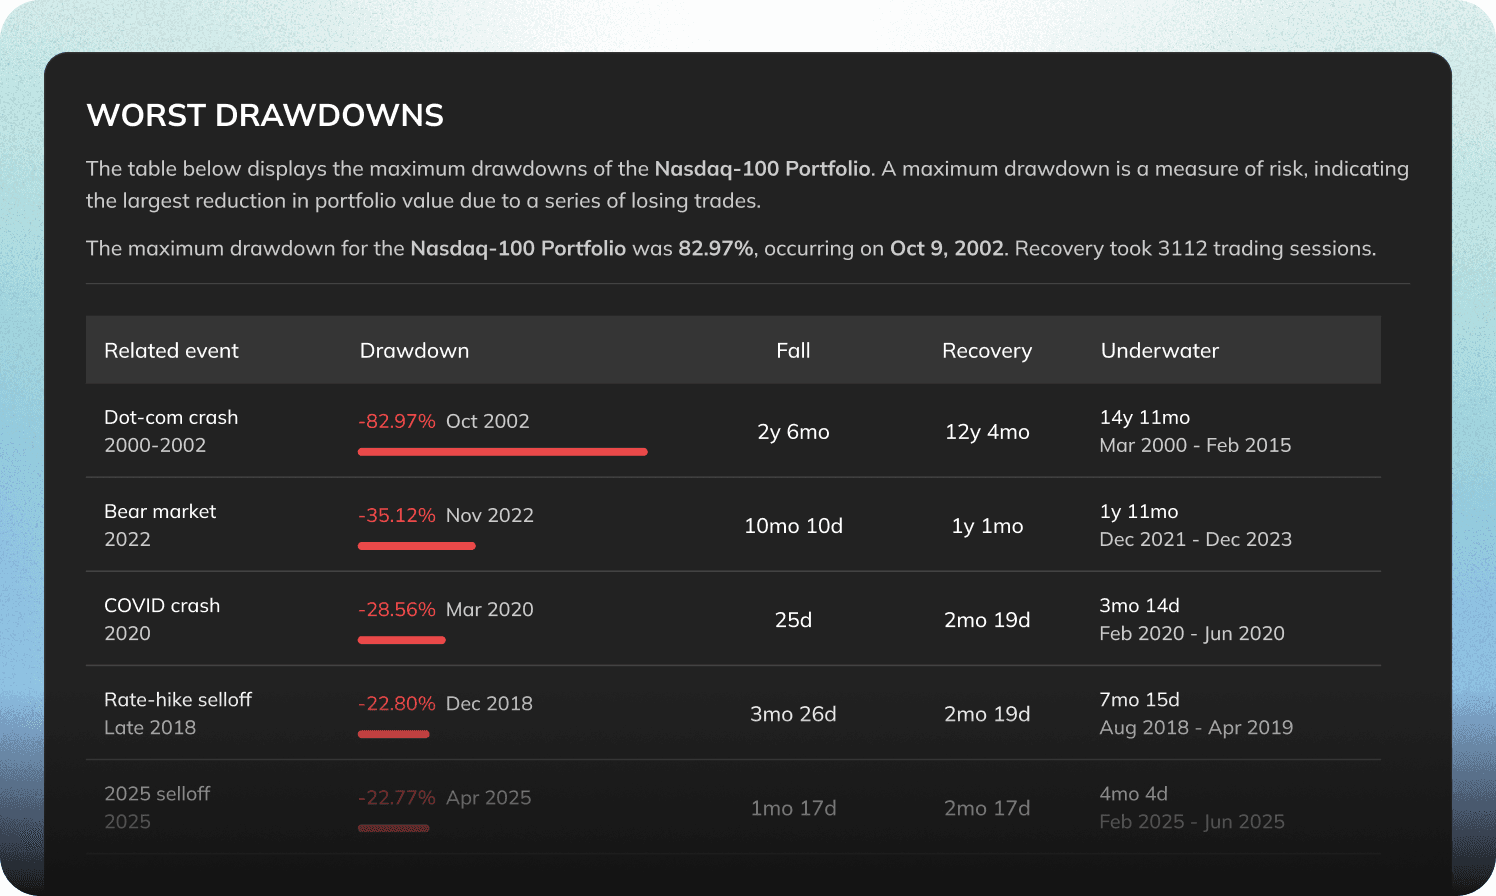
What history shows
Concentrated bets look brilliant in a bull run — right up until the one year that erases them.
The real cost
A tech-heavy mix like this fell 82% in the dot-com crash and took 15 years to recover. Correlation is what turns a drop into a decade underwater.
An allocation built so it doesn't all fall at once
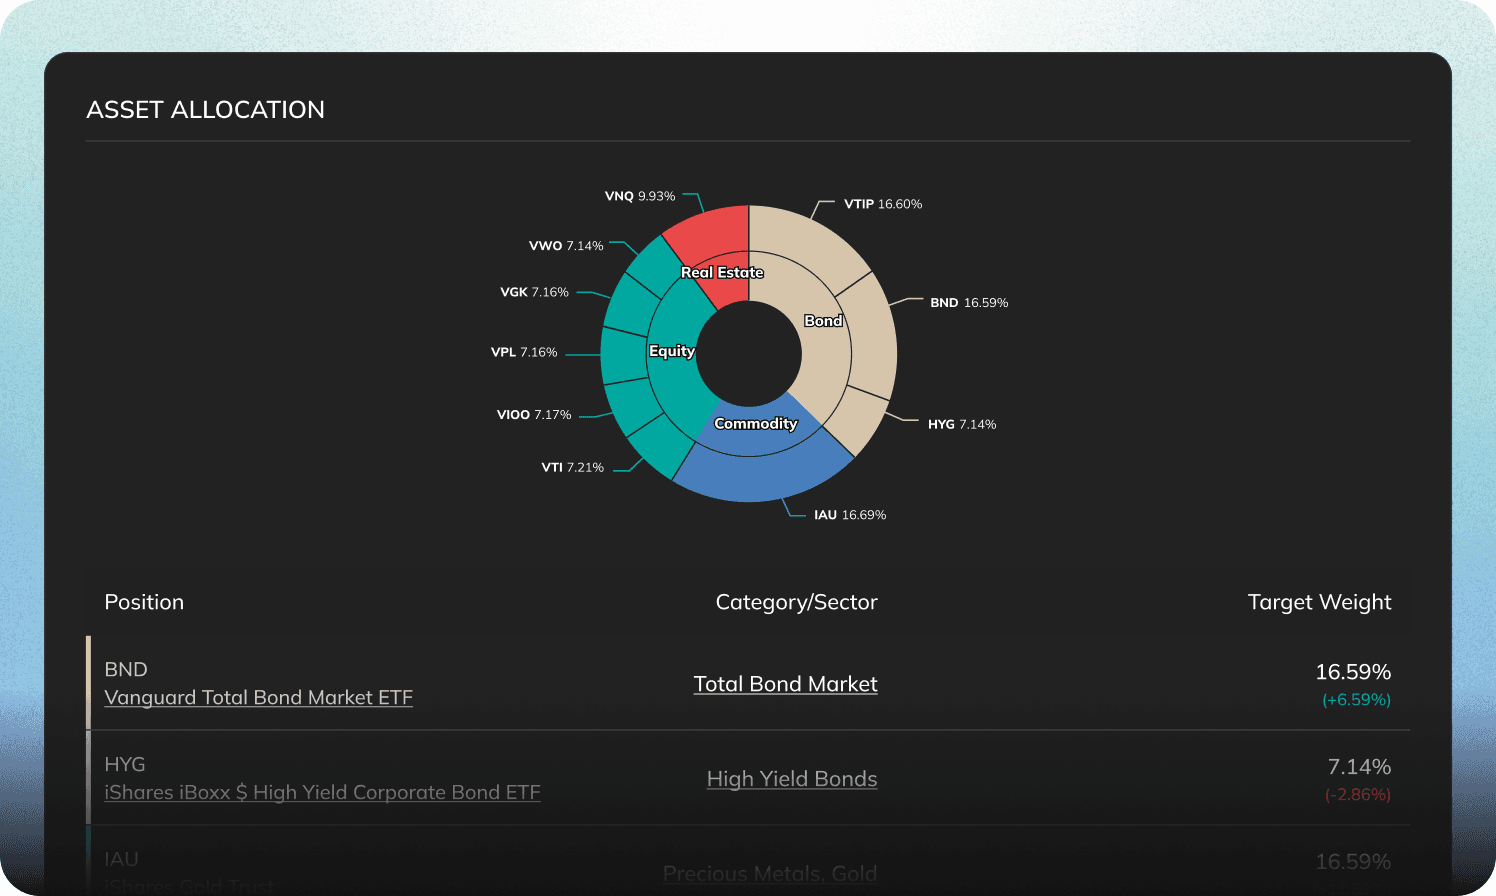
What fixes it
When your holdings don't move in lockstep, one bad sector stops being able to sink the whole portfolio.
Why it holds up
Same goals, less fragility — a mix where a hit to one part doesn't take the rest with it. Backed by math, not guesswork.
see where you stand among 50K+ investor strategies
See how you stack up against investors like you — not an index.
 See where you rank
Weather every storm — and come out ahead
Capture less of the crash, more of the climb — a shallower dip and a faster rebound.
 Optimize your portfolio
research any stock or etf before you buy
Compare return, risk, and historical performance side-by-side — so you can commit with confidence
Build your personal investment hub

Upload & save portfolios

Save the portfolios you use frequently to speed up your work
Customize screener filters

Customize and save the screener settings that work best for you
Maintain up to 10 watchlists

Follow companies you don't have in your portfolio to monitor their dynamics