New: Portfolio Diversification Analysis
Portfolio diversification is easy to talk about and hard to measure.
Most portfolios look diversified on the surface. A few ETFs, maybe some stocks, maybe a bond fund. But once you look at how the positions actually move together, the picture often changes. Five holdings can behave like two bets. A "defensive" position can stop hedging when rates move. Two ETFs with different names can be almost the same exposure.
We built Diversification Analysis to make that visible.
What we added
The new tool analyzes your whole portfolio, not just one symbol at a time. It looks at correlations between positions, effective asset count, diversification ratio, portfolio clusters, and low-correlation candidates you can add.
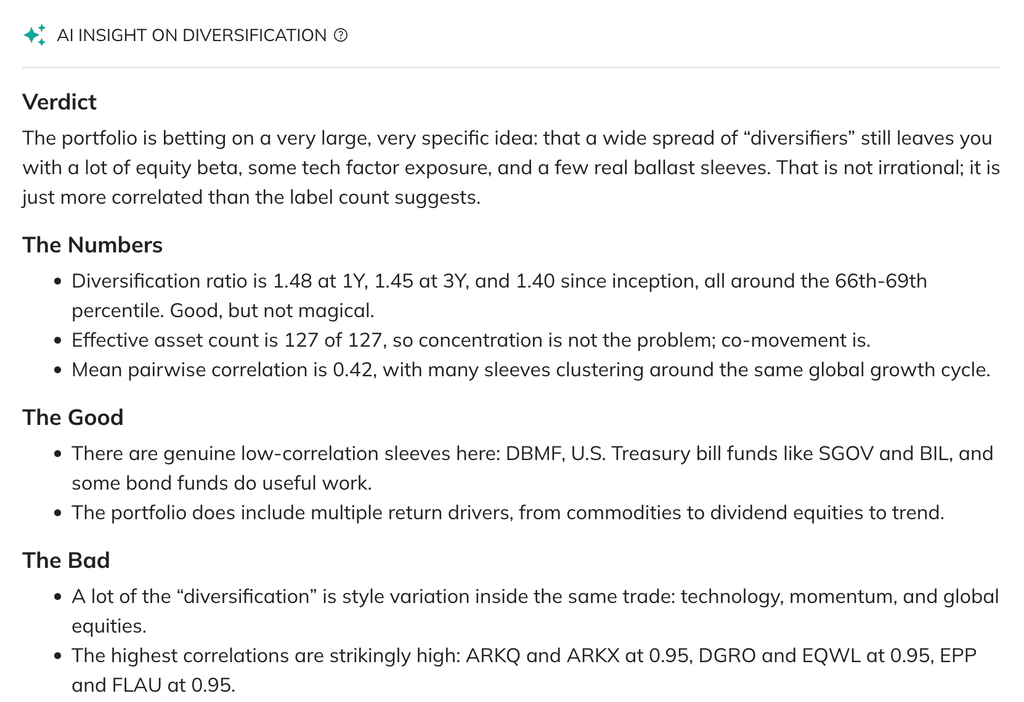
The first thing you see is a plain-English summary of the portfolio. It names the specific positions that are helping or hurting diversification, and explains the trade-off in normal language. Metrics are useful, but sometimes you need the tool to say: these three holdings are mostly doing the same job.
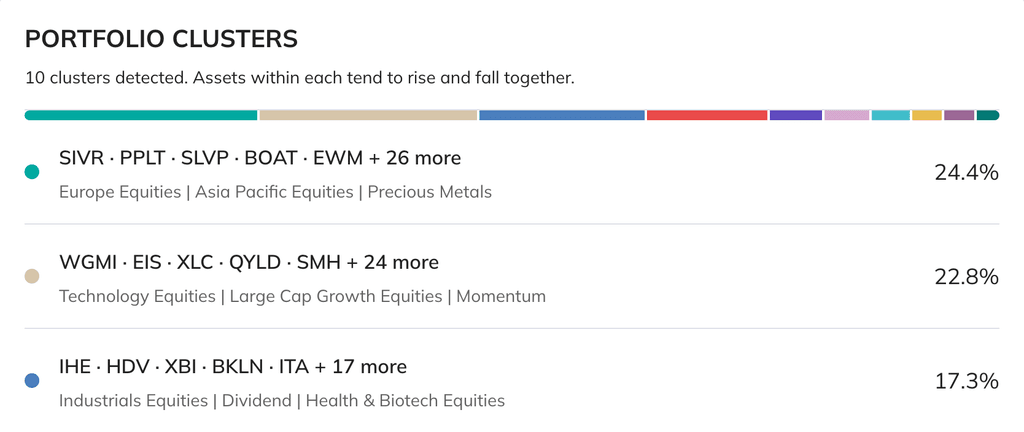
Below that, the tool groups positions into correlation clusters. This is where redundant holdings become obvious. If a portfolio has several large-cap growth ETFs, they may sit in the same cluster even if their issuer, name, and category labels are different.
We also added diversification metrics across multiple periods. Effective asset count shows how many independent bets your portfolio really has. Diversification ratio shows how much volatility reduction you get from combining the assets. Seeing those numbers over 1Y, 3Y, 5Y, 10Y, and all-time helps catch drift. A portfolio can become less diversified without any transaction, simply because correlations changed.
New candidates, not generic lists
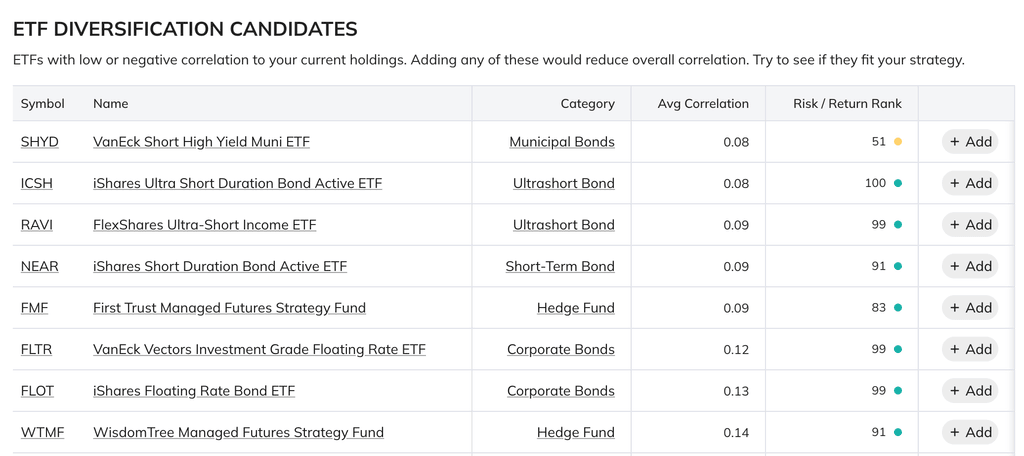
The tool now surfaces ETF and stock candidates that historically moved differently from your current holdings.
This is not a generic "top ETFs" list. Candidates are filtered by correlation to the actual portfolio, then by quality. For ETFs we avoid inverse and leveraged products and require meaningful assets under management. For stocks we focus on larger companies and include risk / return rank, so the list is not just "lowest correlation at any cost."
You can add a candidate directly into the portfolio input, rerun the analysis, and see what changed. That makes the workflow much more practical. Instead of guessing whether a commodity ETF, short-duration bond ETF, or defensive stock helps, you can test it against the current portfolio structure.
Why this matters for optimization
Portfolio Optimization works better when the input universe is sane.
If you feed an optimizer five highly correlated ETFs, it can still produce nice-looking weights. But the result may be mostly a reshuffle of the same exposure. The optimizer is not magic. It can only choose from the assets you give it.
Diversification Analysis helps before optimization. Use it to remove duplicates, spot clusters, and find candidates with genuinely different return drivers. Then run optimization on a cleaner universe.
This creates a better workflow:
- Start with Diversification Analysis.
- Remove obvious overlap.
- Add a few low-correlation candidates.
- Run Portfolio Optimization.
- Validate the optimized result with walk-forward backtesting.
That sequence is more useful than optimizing first and trying to explain the result afterward.
A few ways to use it
You have a 3-5 ETF portfolio and want to know what is missing. Run Diversification Analysis, look at the clusters, then check ETF candidates. If all holdings behave like equity beta, the tool will usually make that obvious.
You are preparing a portfolio for optimization. Before running HRP, Risk Parity, or Mean-Variance Optimization, use the clusters to remove duplicates and add assets with different behavior. The optimization result should be more stable because the input set is better.
You are reviewing an existing allocation after market conditions changed. Correlations are not fixed. The 1Y view may show that a hedge is no longer doing what you expected, while the longer windows show whether this is temporary or structural.
Try Diversification Analysis with your portfolio
0 comments
Sort by