

Your portfolio is currently empty. You can import holdings, add them manually, or start with a popular portfolio.
What you'll see
Below: sample output from analyzing the All Weather Portfolio. Add your holdings above to analyze your own.
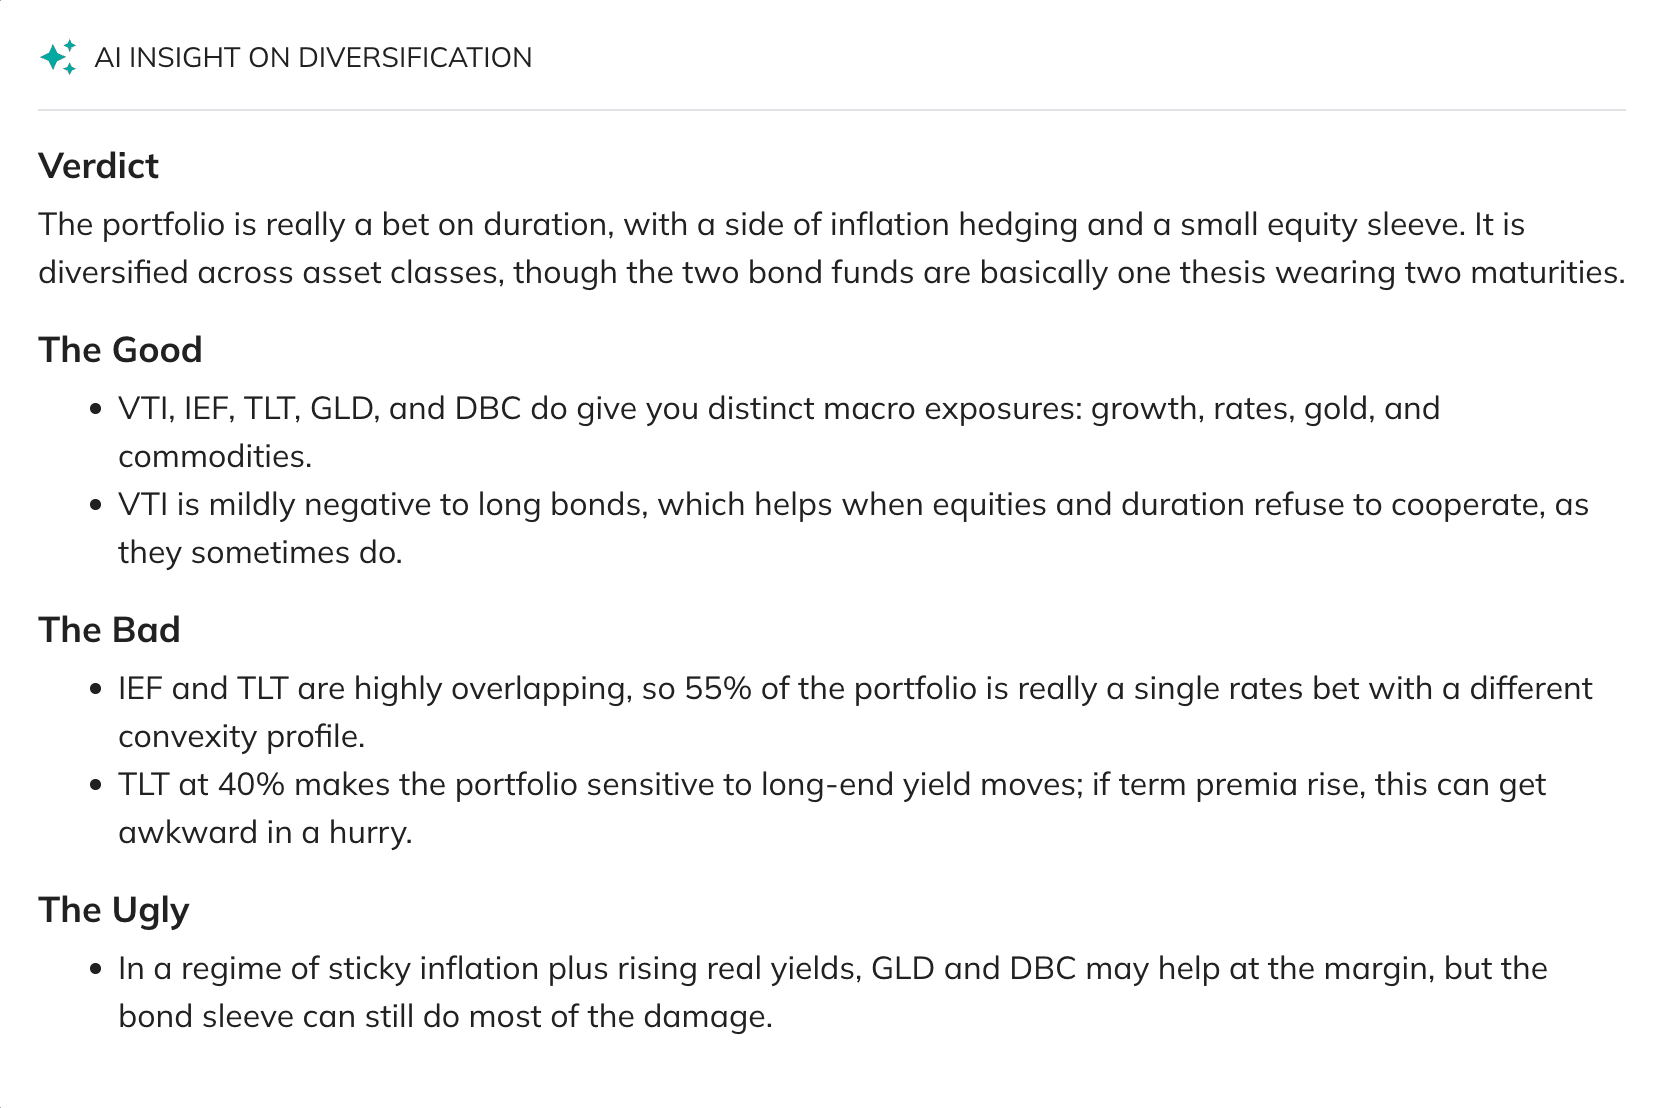
Portfolio analysis in plain English
- Reads your portfolio like an analyst would, naming specific tickers and trade-offs
- Highlights what's working — genuine diversification — and what isn't
- Surfaces risks the metrics alone won't show, like a hedge that quietly turns into a source of losses
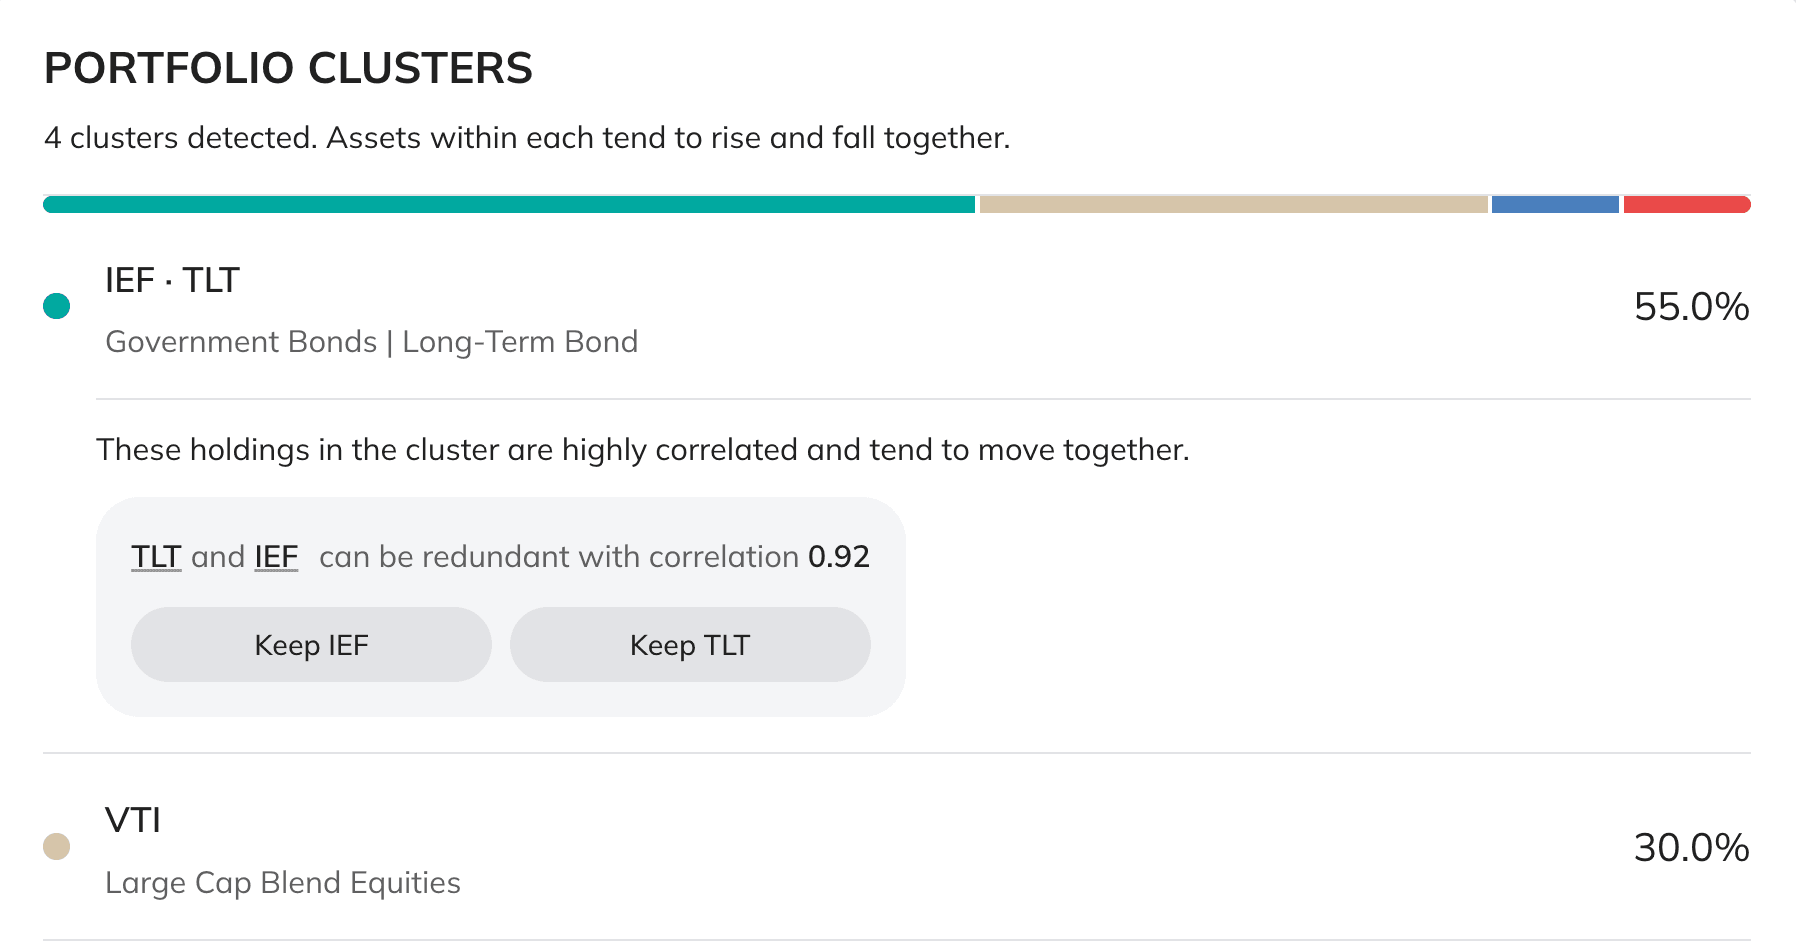
Find overlapping or redundant holdings
- Groups your assets by how they actually move, not by sector labels
- Detects holdings that look diversified but rise and fall together
- Identifies share-class duplicates and near-identical ETFs you can consolidate
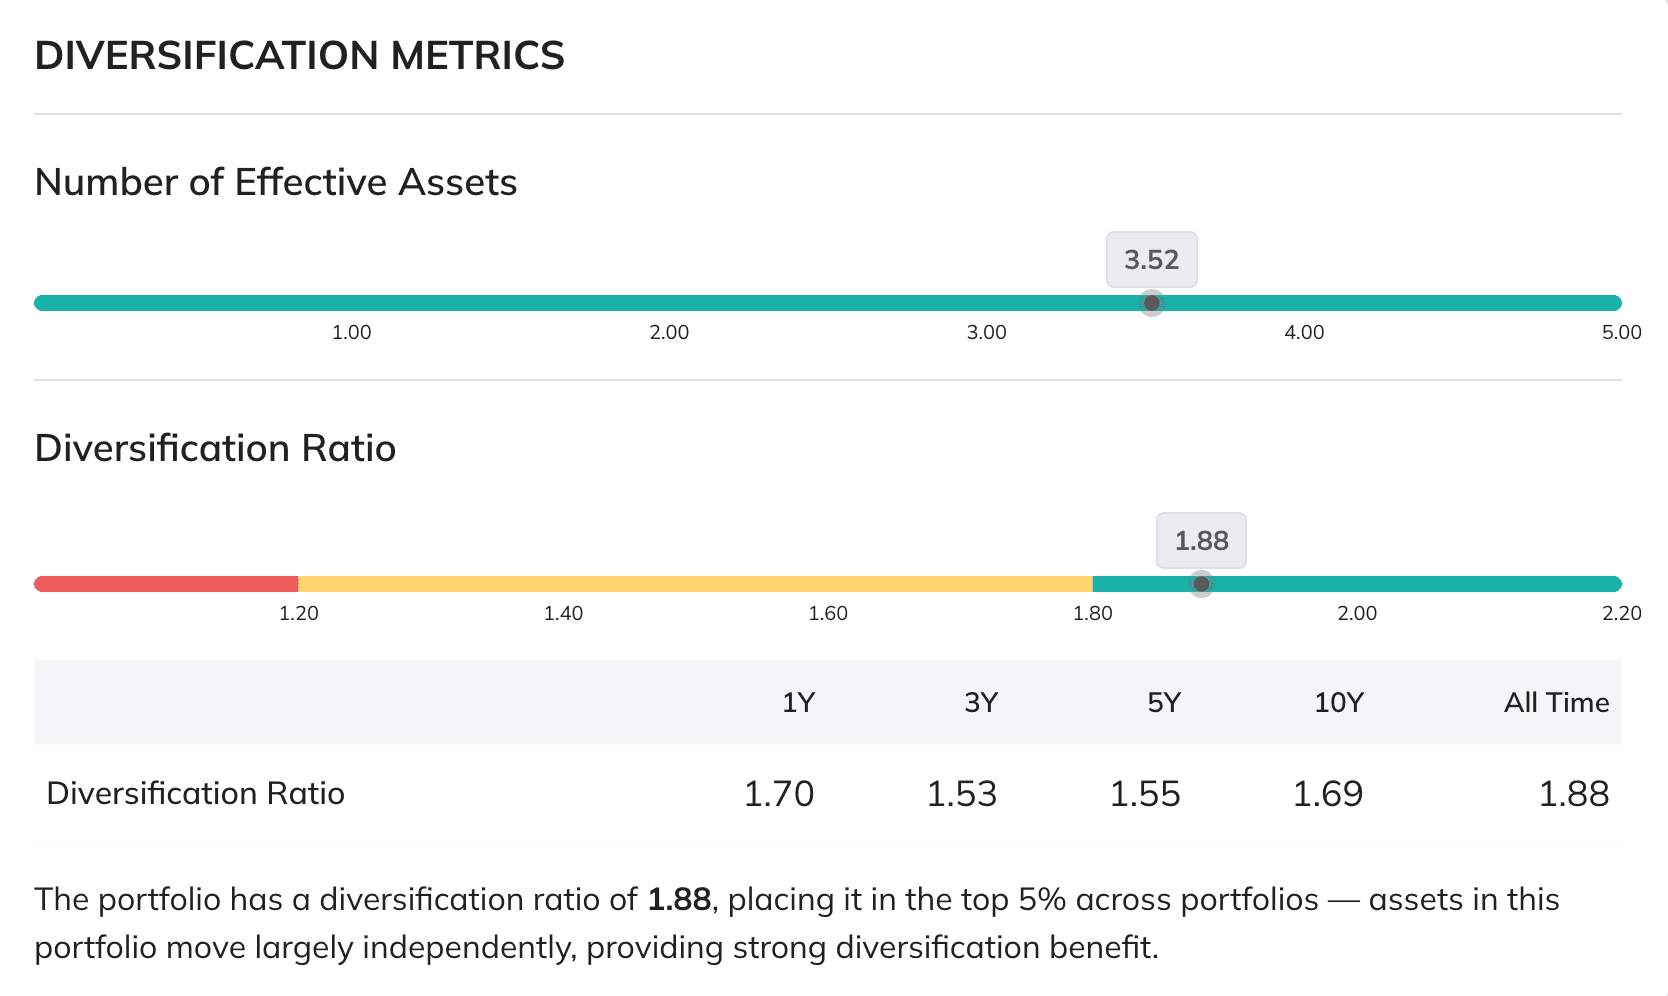
Measure how diversified you really are
- Effective asset count shows how many of your positions are actually doing work
- Diversification ratio quantifies how much risk reduction you're getting from combining assets
- Metrics tracked across 1Y, 3Y, 5Y, 10Y, and all-time — see if diversification is drifting
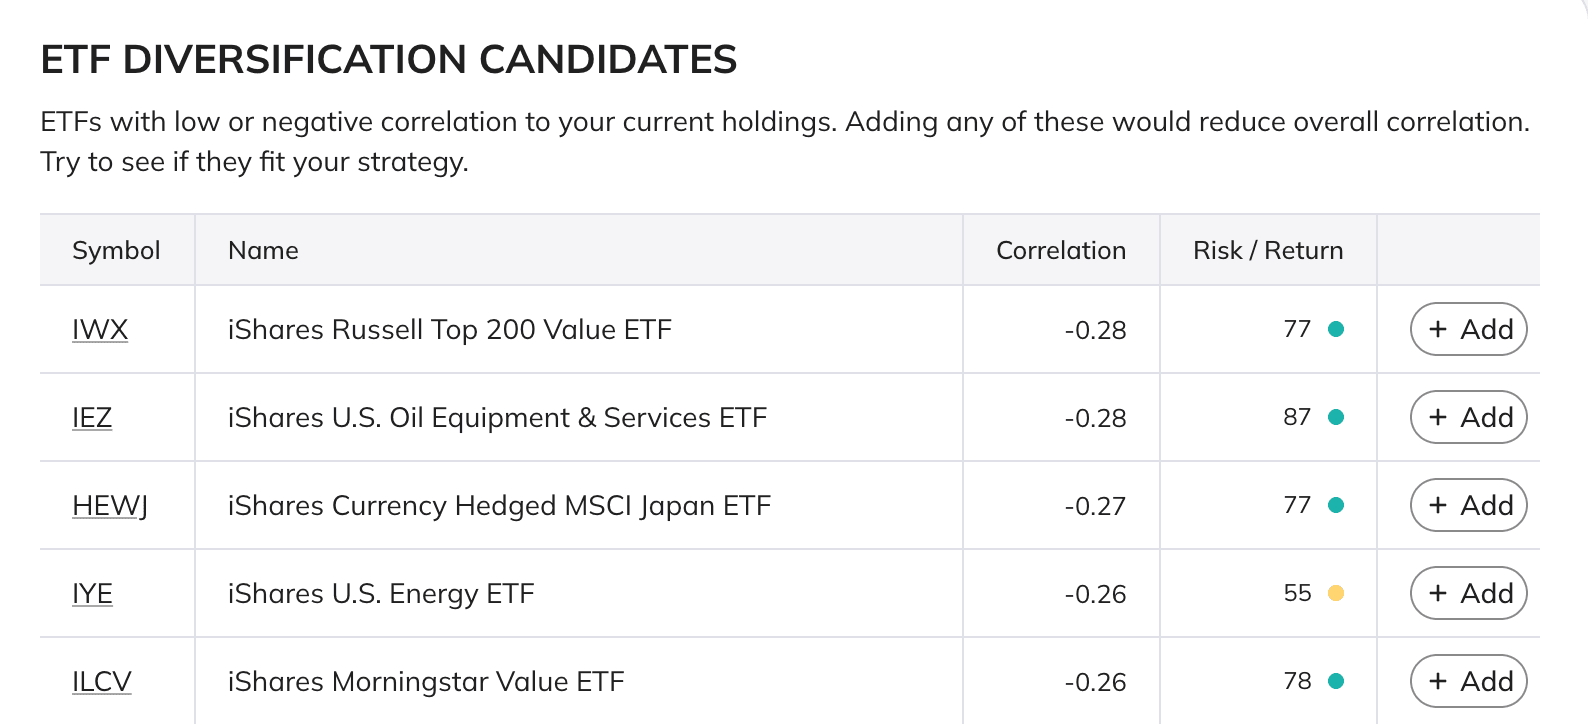
Discover assets that improve diversification
- Personalized ETF and stock candidates based on your portfolio's current correlations
- Filtered by quality — only assets with strong risk and return profiles
- One-click preview to see how each addition would change your diversification metrics