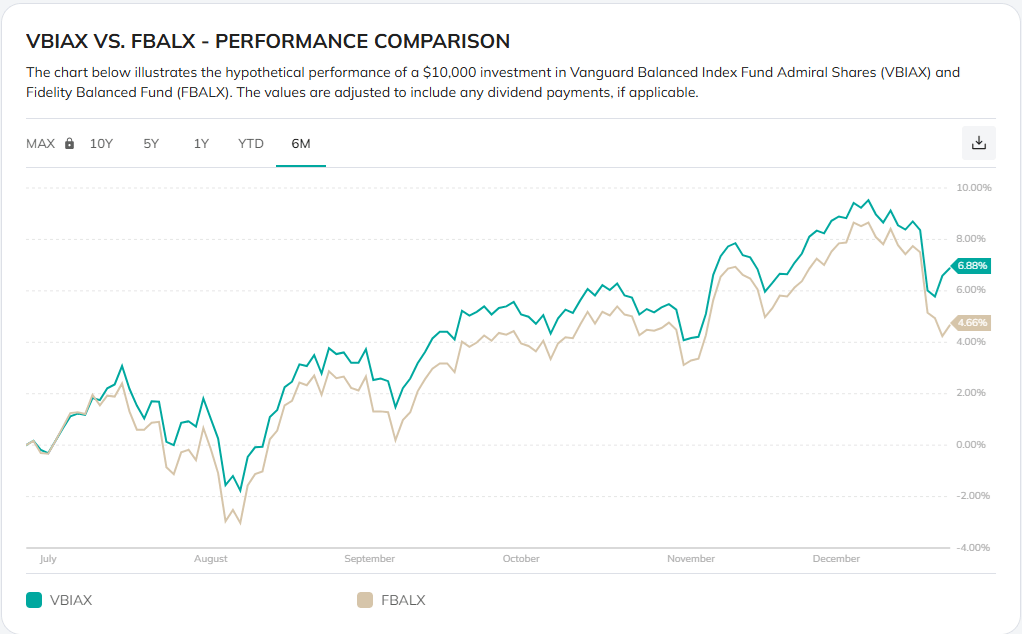
Do Performance Comparison chart include Expense Ratio (fees)?
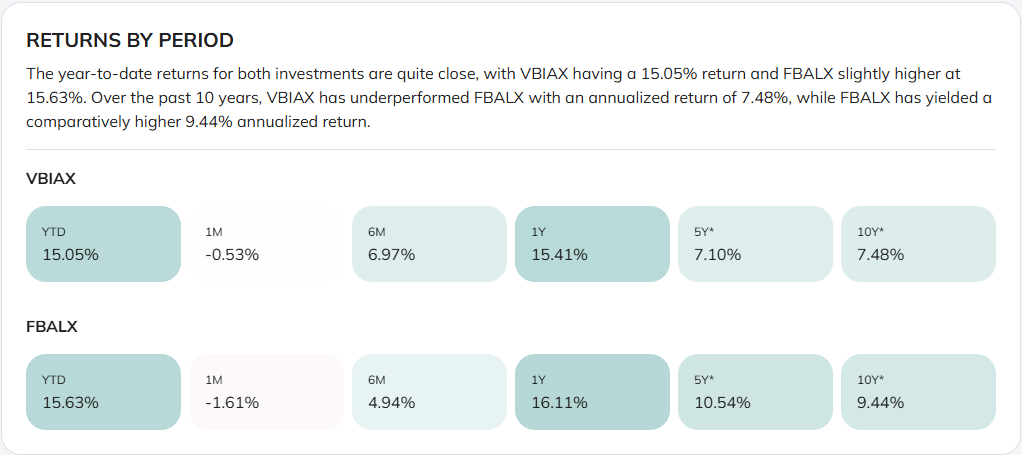
When comparing two funds, the performance chart says "The values are adjusted to include any dividend payments, if applicable.", so can anyone tell me whether the growth also includes expense ratio fees? For instance, when comparing VBIAX and FBALX, the expense ratio of FBALX is significantly higher than VBAIX, at 0.51 vs 0.06, so that needs to be accounted for. The year-to-date returns for both investments are quite close, but at 5YR and 10YRm FBALX outperforms VBIAX by quite a lot.
Anyone know for certain?
1 comment
Sort by
Hi,
Fund expense ratios are already factored into the reported daily prices (and thus returns calculated based on them). Historical daily prices for mutual funds are typically reported net of management fees and expenses.
This means the prices already account for the impact of the fund's expense ratio, which includes management fees and other operating costs. These fees are deducted directly from the fund's assets before calculating the net asset value (NAV), so investors don’t pay them separately.